Project Management
/Reports
Reports
PM Indexes
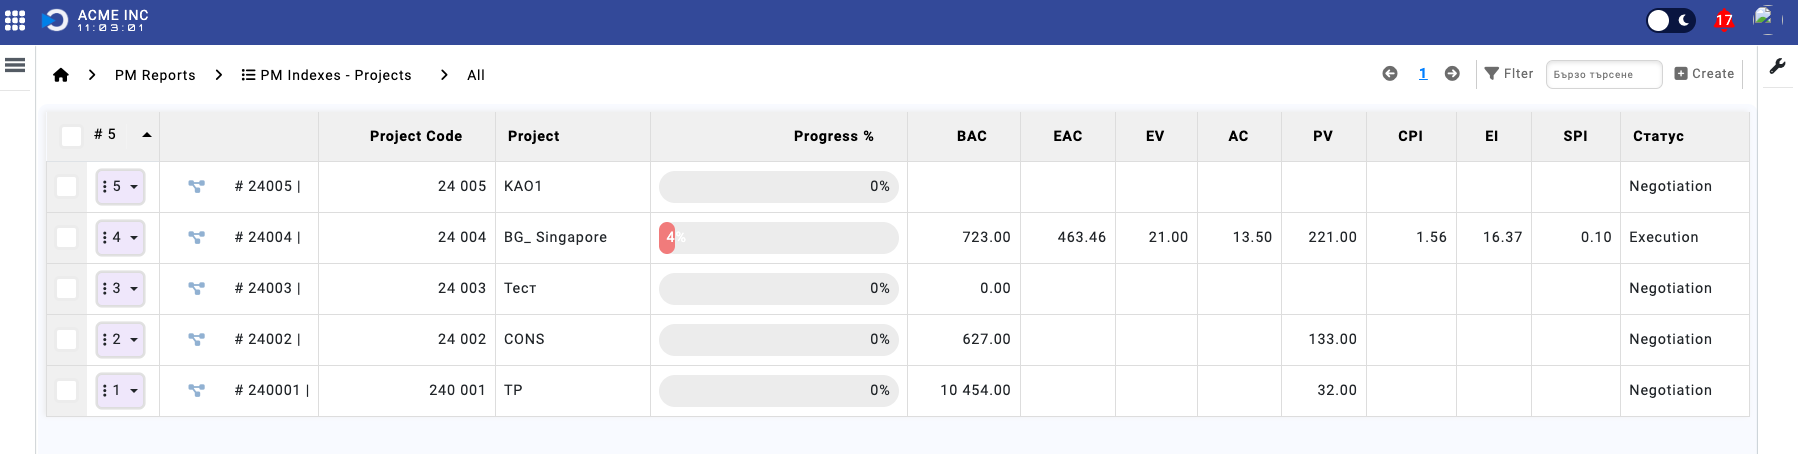
The module PM Indexes – Projects is used to store information about the project management indexes for each project.
The following indexes are stored in this module on a regular basis:
- BAC – Budget at Completion: Total planned value of the project. Calculated as the sum of all offered (planned) hours (PV) for all project tasks (N).
- EAC – Estimate at Completion: Estimated total cost of the project upon completion, calculated as BAC / CPI.
- EV – Earned Value: Value of work actually completed so far. Calculated as the sum of planned hours for all closed tasks.
- AC – Actual Cost: Total hours spent so far for completed tasks. Formula: ∑AC(n)
- PV – Planned Value: Approved budget for tasks that should have been completed by now. Formula: ∑PV(nt)
- CPI – Cost Performance Index: Efficiency of cost usage so far. Calculated as EV / AC.
- EI – Effort Index: Comparison between planned and actual hours for completed tasks. Formula: PV / AC.
- SPI – Scheduled Performance Index: Comparison between work performed and planned schedule. Formula: EV / PV.
Two jobs in the main scheduler populate the indexes with data daily at 08:00 and 16:00:
- Generates
pm_indexes_all_projectsat 08:00 - Generates
pm_indexes_all_projectsat 16:00
Team Utilization Breakdown
The Team Utilization Breakdown report provides a comprehensive overview of employee workload and capacity utilization across your organization. This interactive dashboard helps managers identify over-utilized and under-utilized team members, optimize resource allocation, and make data-driven staffing decisions.
Key Features
📊 Flexible Grouping Options
View your team's utilization data organized in 15 different ways to match your analysis needs:
- Single-level grouping: Office, Position, Department, or Employee
- Two-level grouping: Office → Position, Office → Department, Position → Department, and more
- Three-level grouping: Office → Department → Position for complete hierarchical analysis
💡 Tip: Use the Group By dropdown with the help icon (?) to explore all available grouping combinations and find the view that best suits your reporting needs.
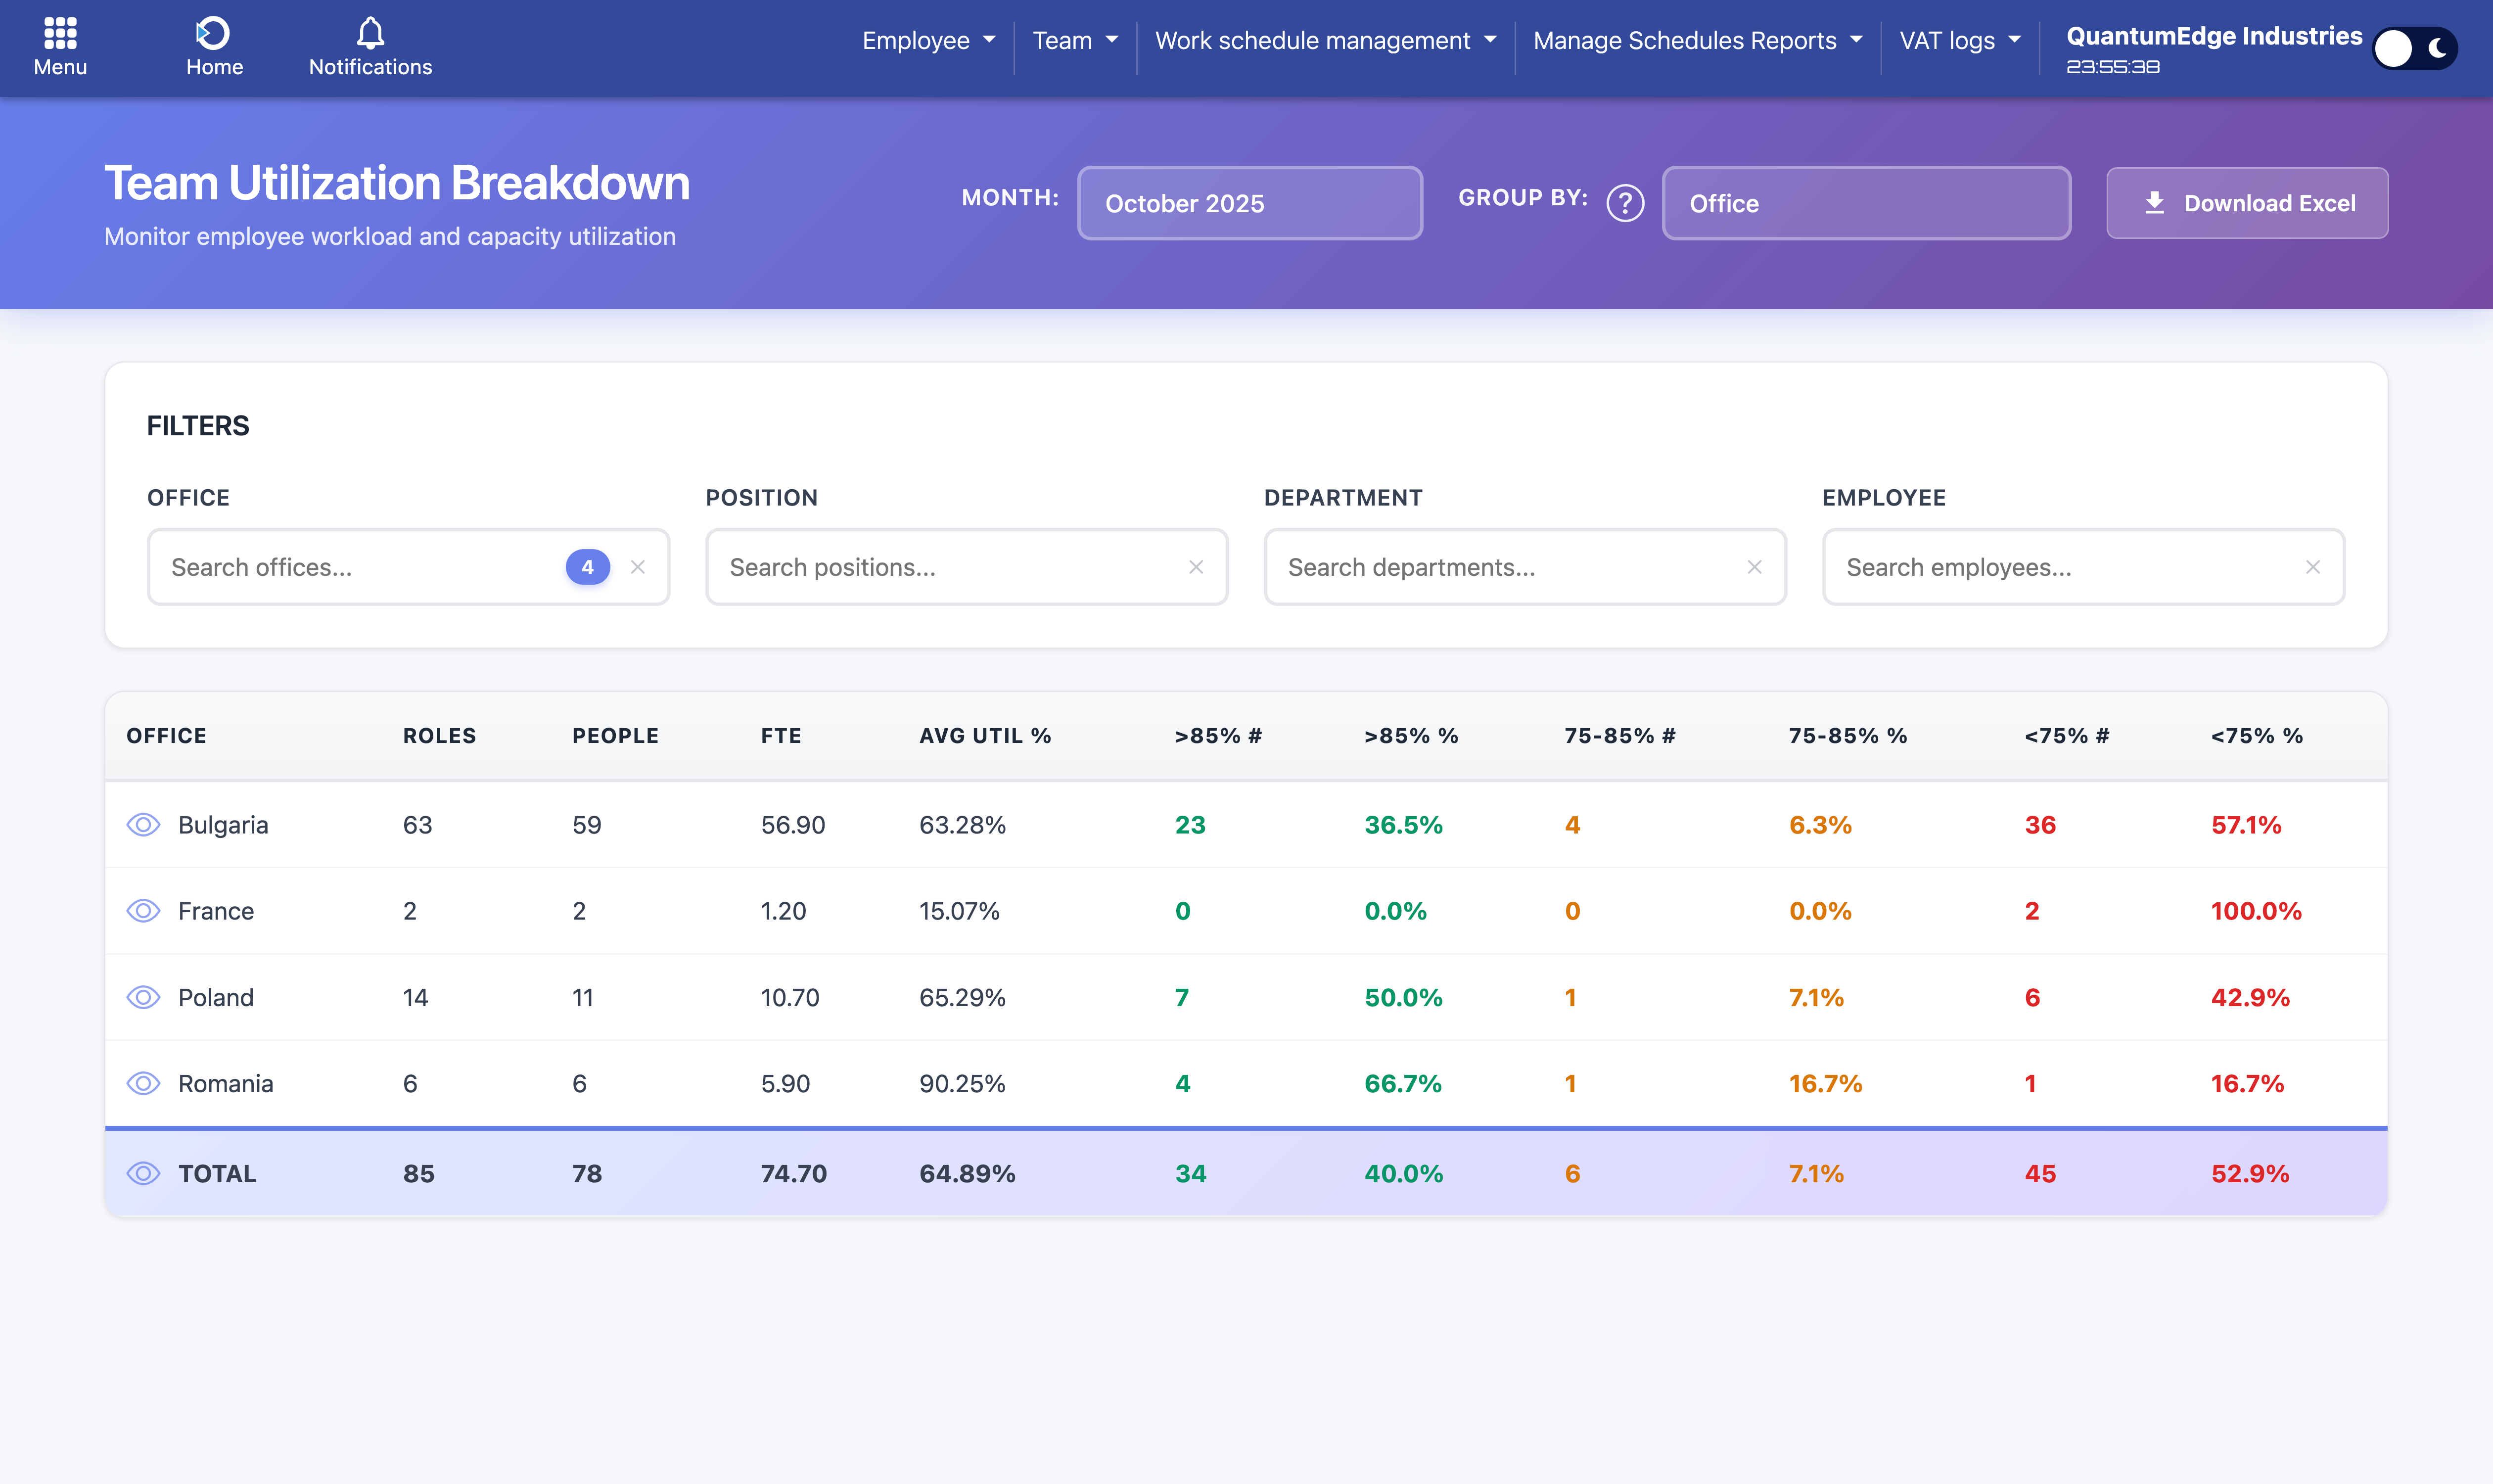
Main dashboard showing utilization breakdown grouped by Office with live filters
🔍 Advanced Filtering
Narrow down your analysis using the live-search filter system:
- Office filter: Select one or multiple offices to focus your analysis
- Position filter: Filter by job roles and positions
- Department filter: Analyze specific departments or teams
- Employee filter: Look up individual team members by name
All filters work together, and selections are reflected immediately in the table. Simply type to search and check/uncheck items to refine your view.
📅 Time Period Selection
The month selector lets you analyze any month from the past year or plan ahead for the next two months. Choose your desired period to see utilization data specific to that timeframe.
Understanding the Data
Core Metrics
- Roles: Number of employee-position combinations (e.g., one employee in two positions counts as 2 roles)
- People: Count of unique individuals regardless of how many positions they hold
- FTE: Total Full-Time Equivalent capacity for the group
- AVG UTIL %: Average utilization percentage across all members in the group
Utilization Breakdown Columns
The report splits team members into three utilization categories, showing both count and percentage:
- >85% (Green): Employees with high utilization - fully loaded or potentially over-utilized
- 75-85% (Orange): Employees with optimal utilization - good capacity balance
- <75% (Red): Employees with low utilization - available capacity for additional work
⚠️ Important: Color coding helps you quickly identify capacity issues. High numbers in the red columns indicate underutilized resources, while high numbers in green columns may signal potential burnout risks.
Interactive Features
👁️ Drill-Down View
Click the eye icon next to any row (including the TOTAL row) to see the detailed employee breakdown:
- Employee name with their specific position
- Office and Department (shown in TOTAL breakdown only)
- FTE allocation for that employee
- Billable hours logged during the period
- Available hours based on FTE and working days
- Utilization percentage calculated from billable vs available hours
The breakdown modal includes an Excel export button to download the detailed list for further analysis.
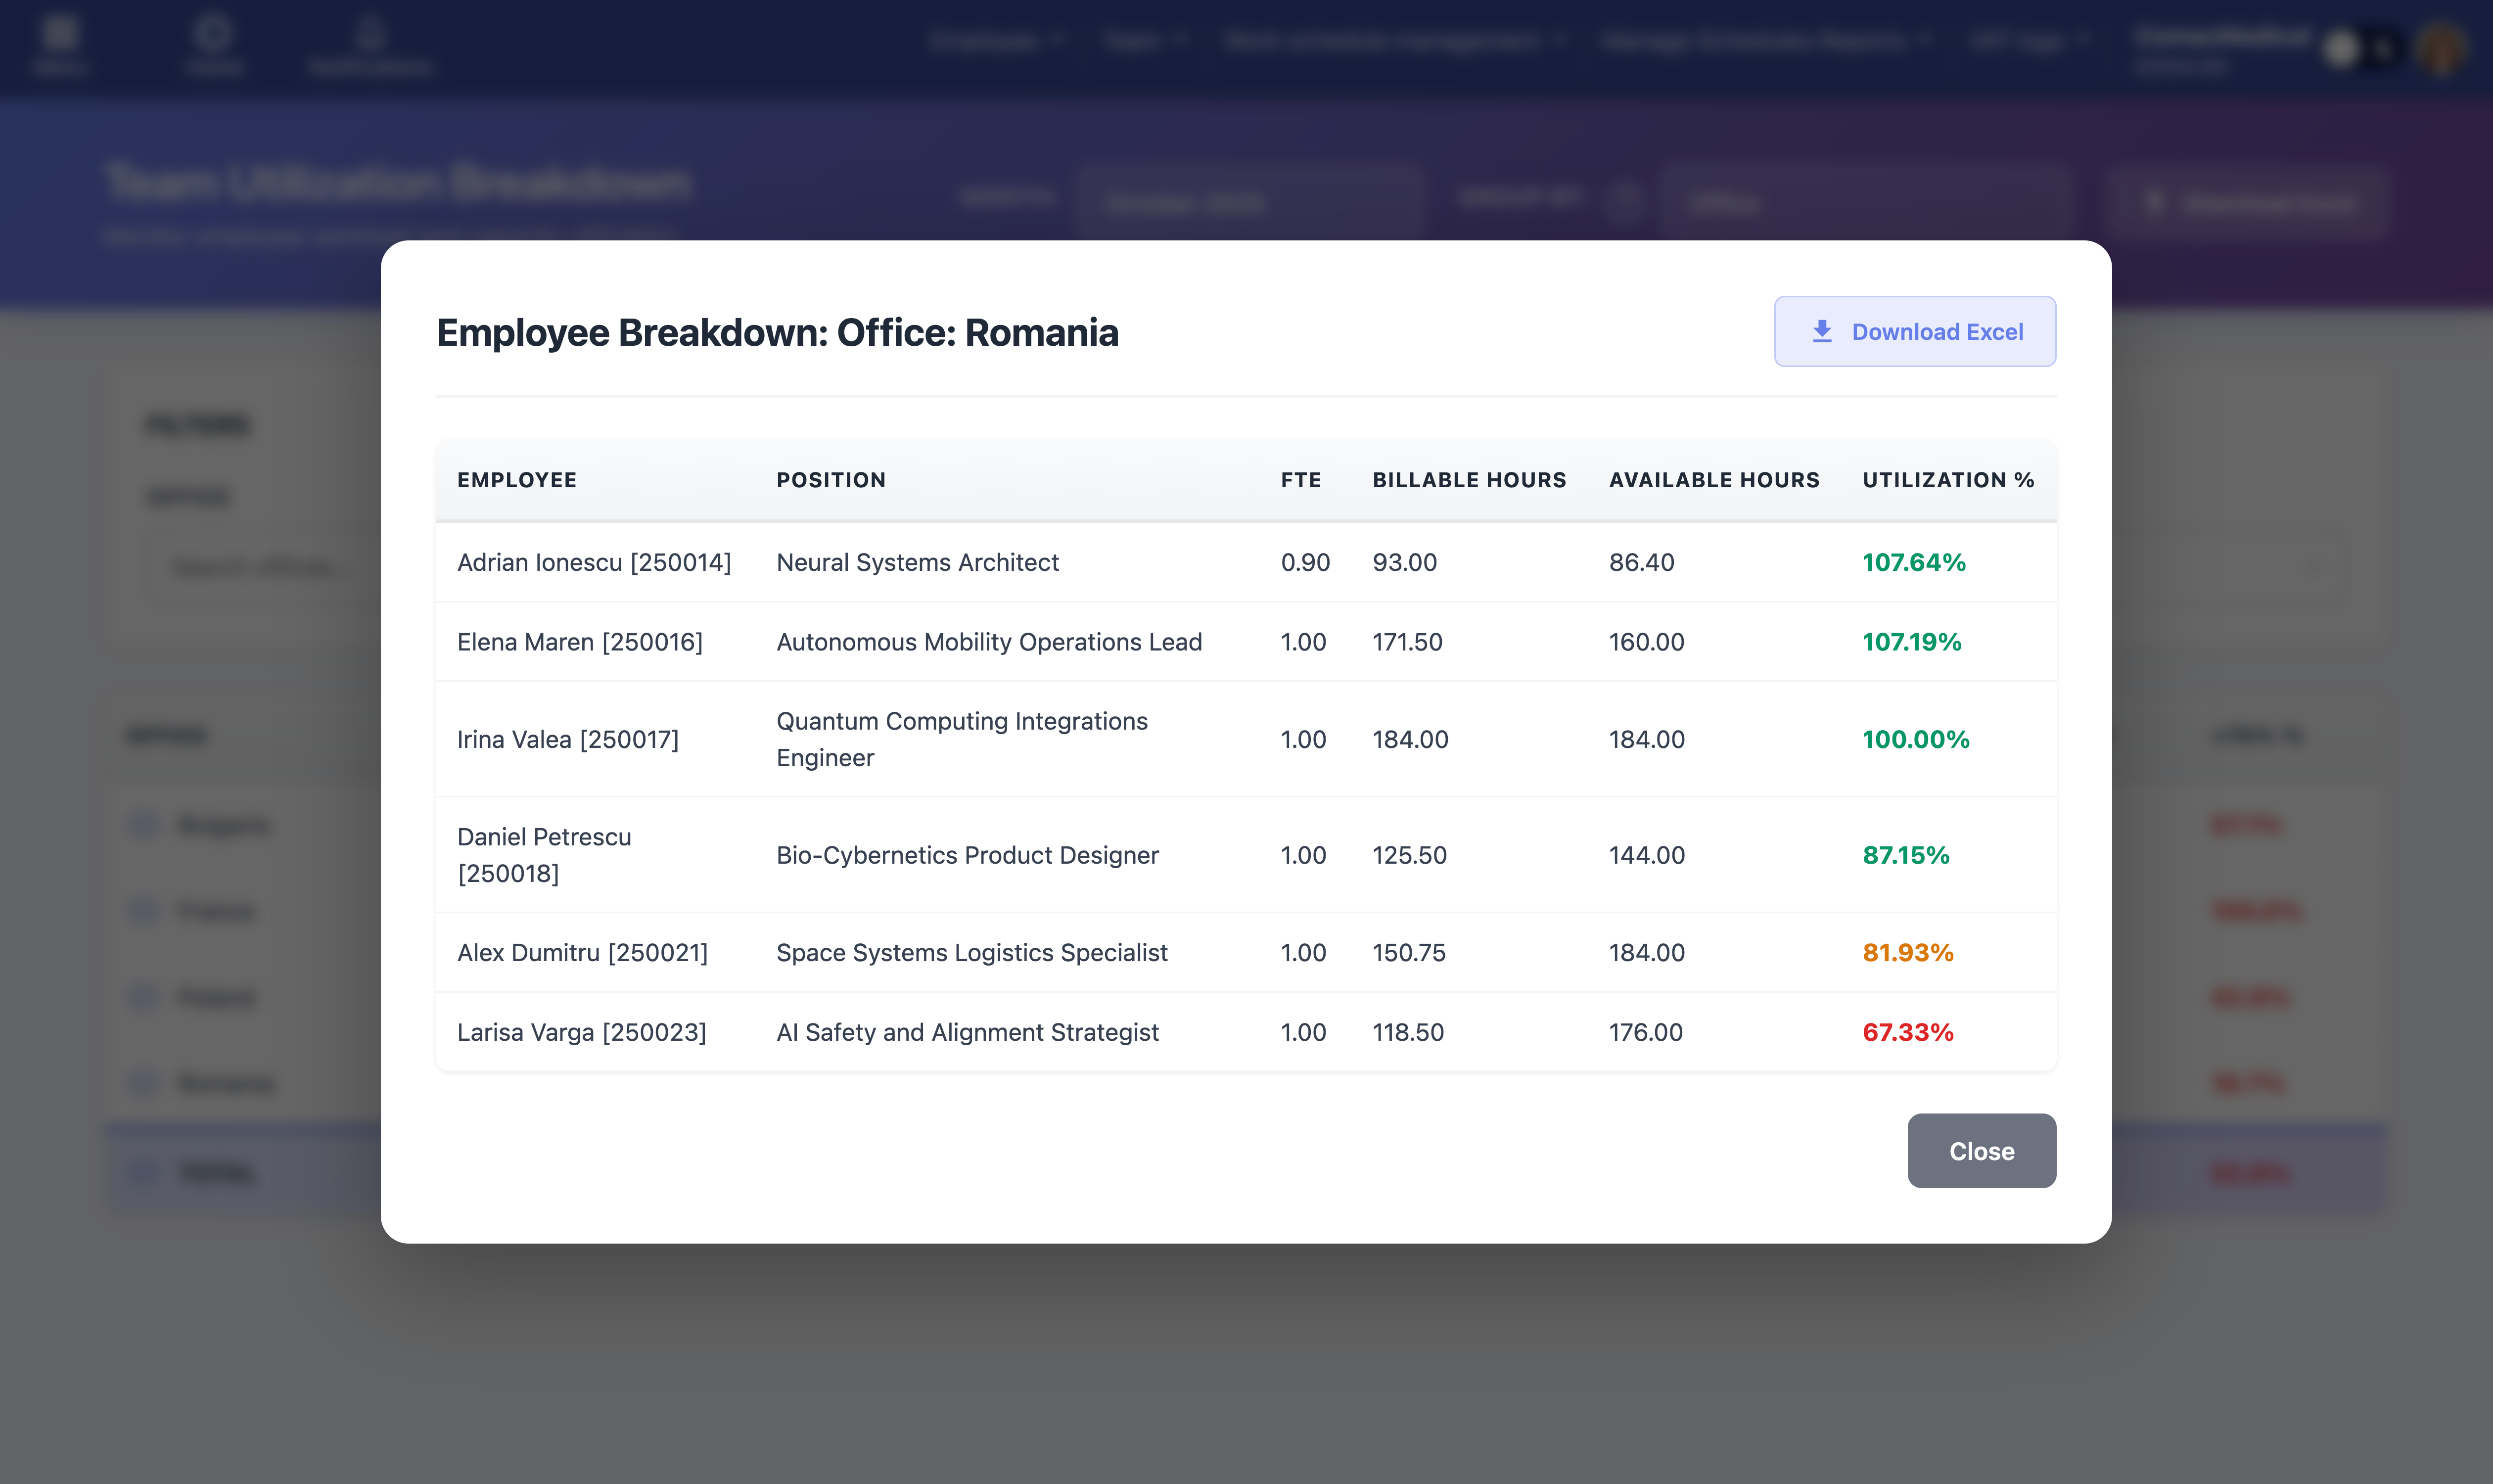
Detailed employee breakdown modal showing individual utilization metrics
📥 Excel Export
Export your analysis to Excel for sharing or offline work:
- Main table export: Click "Download Excel" in the header to export the entire grouped view with all filters applied
- Breakdown export: Use the export button in the drill-down modal to download the detailed employee list
Excel files include metadata (report date, selected month, applied filters) and are formatted with headers and proper column widths for immediate use.
Common Use Cases
- Resource Planning: Identify employees with available capacity when new projects arise
- Workload Balancing: Spot over-utilized team members and redistribute work to prevent burnout
- Performance Reviews: Use utilization data as one metric for evaluating productivity and capacity
- Budget Planning: Understand current capacity utilization to make informed hiring decisions
- Office/Department Comparison: Compare utilization across different locations or teams to identify imbalances
✅ Best Practice: Review this report monthly with your team leads to proactively manage capacity and workload distribution. Combine insights from different grouping views to get a complete picture of your organization's resource utilization.
Task Violation Report
...
Time Tracking per Employee
...
Time Tracking per Employee and Category
...