Attendence and access
/How the System Works
How the System Works
The Attendance and Access solution transforms raw access control events into structured attendance, working time, and safety information. Every badge scan is captured, processed automatically, and reflected in shifts, daily summaries, and operational reports.
The system runs continuously in the background and keeps attendance data accurate up to the last processing cycle. This ensures that HR, management, and security always work with up-to-date and traceable information.
Overview
The solution connects physical access control systems with attendance and workforce reporting.
When an employee scans a badge:
- The access event is recorded.
- Events are grouped into work shifts.
- Daily attendance summaries are calculated.
- Reports and monitors are updated automatically.
The system produces:
- Detailed access logs - Every entry and exit recorded with timestamps.
- Calculated work shifts - Grouped events forming complete shifts.
- Daily attendance summaries - Aggregated data per employee per day.
- Net work time per zone - Time spent in productive work areas.
- Real-time lone worker status - Current location and safety visibility.
All calculations are auditable and can be recalculated when new data arrives.
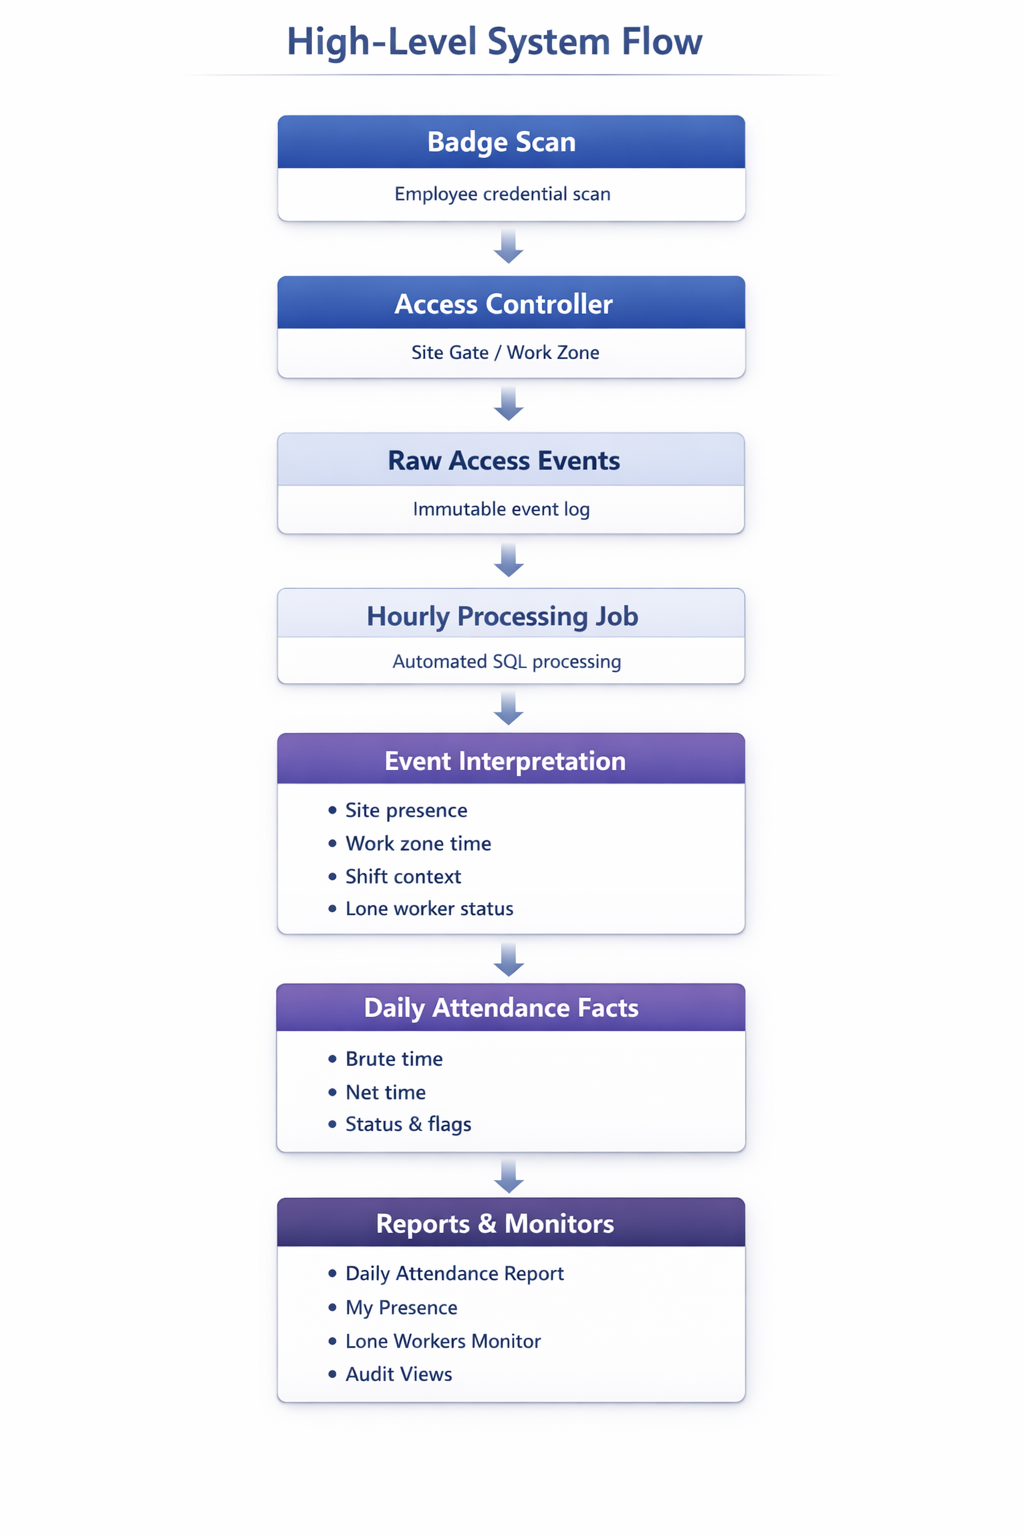
High-level system flow: from badge scan to reports
Data Sources
The system operates on a limited and well-defined set of data sources:
- Access controllers - Physical devices such as turnstiles, doors, or zone readers.
- Access events - Each entry or exit generated by a controller.
- Employee data - Employees, departments, and organizational structure.
- Planned schedules - Shifts and shift codes defining expected working time and leave.
Access events may arrive directly from a controller integration or through an intermediate data import. All events are stored permanently for audit, traceability, and recalculation purposes.
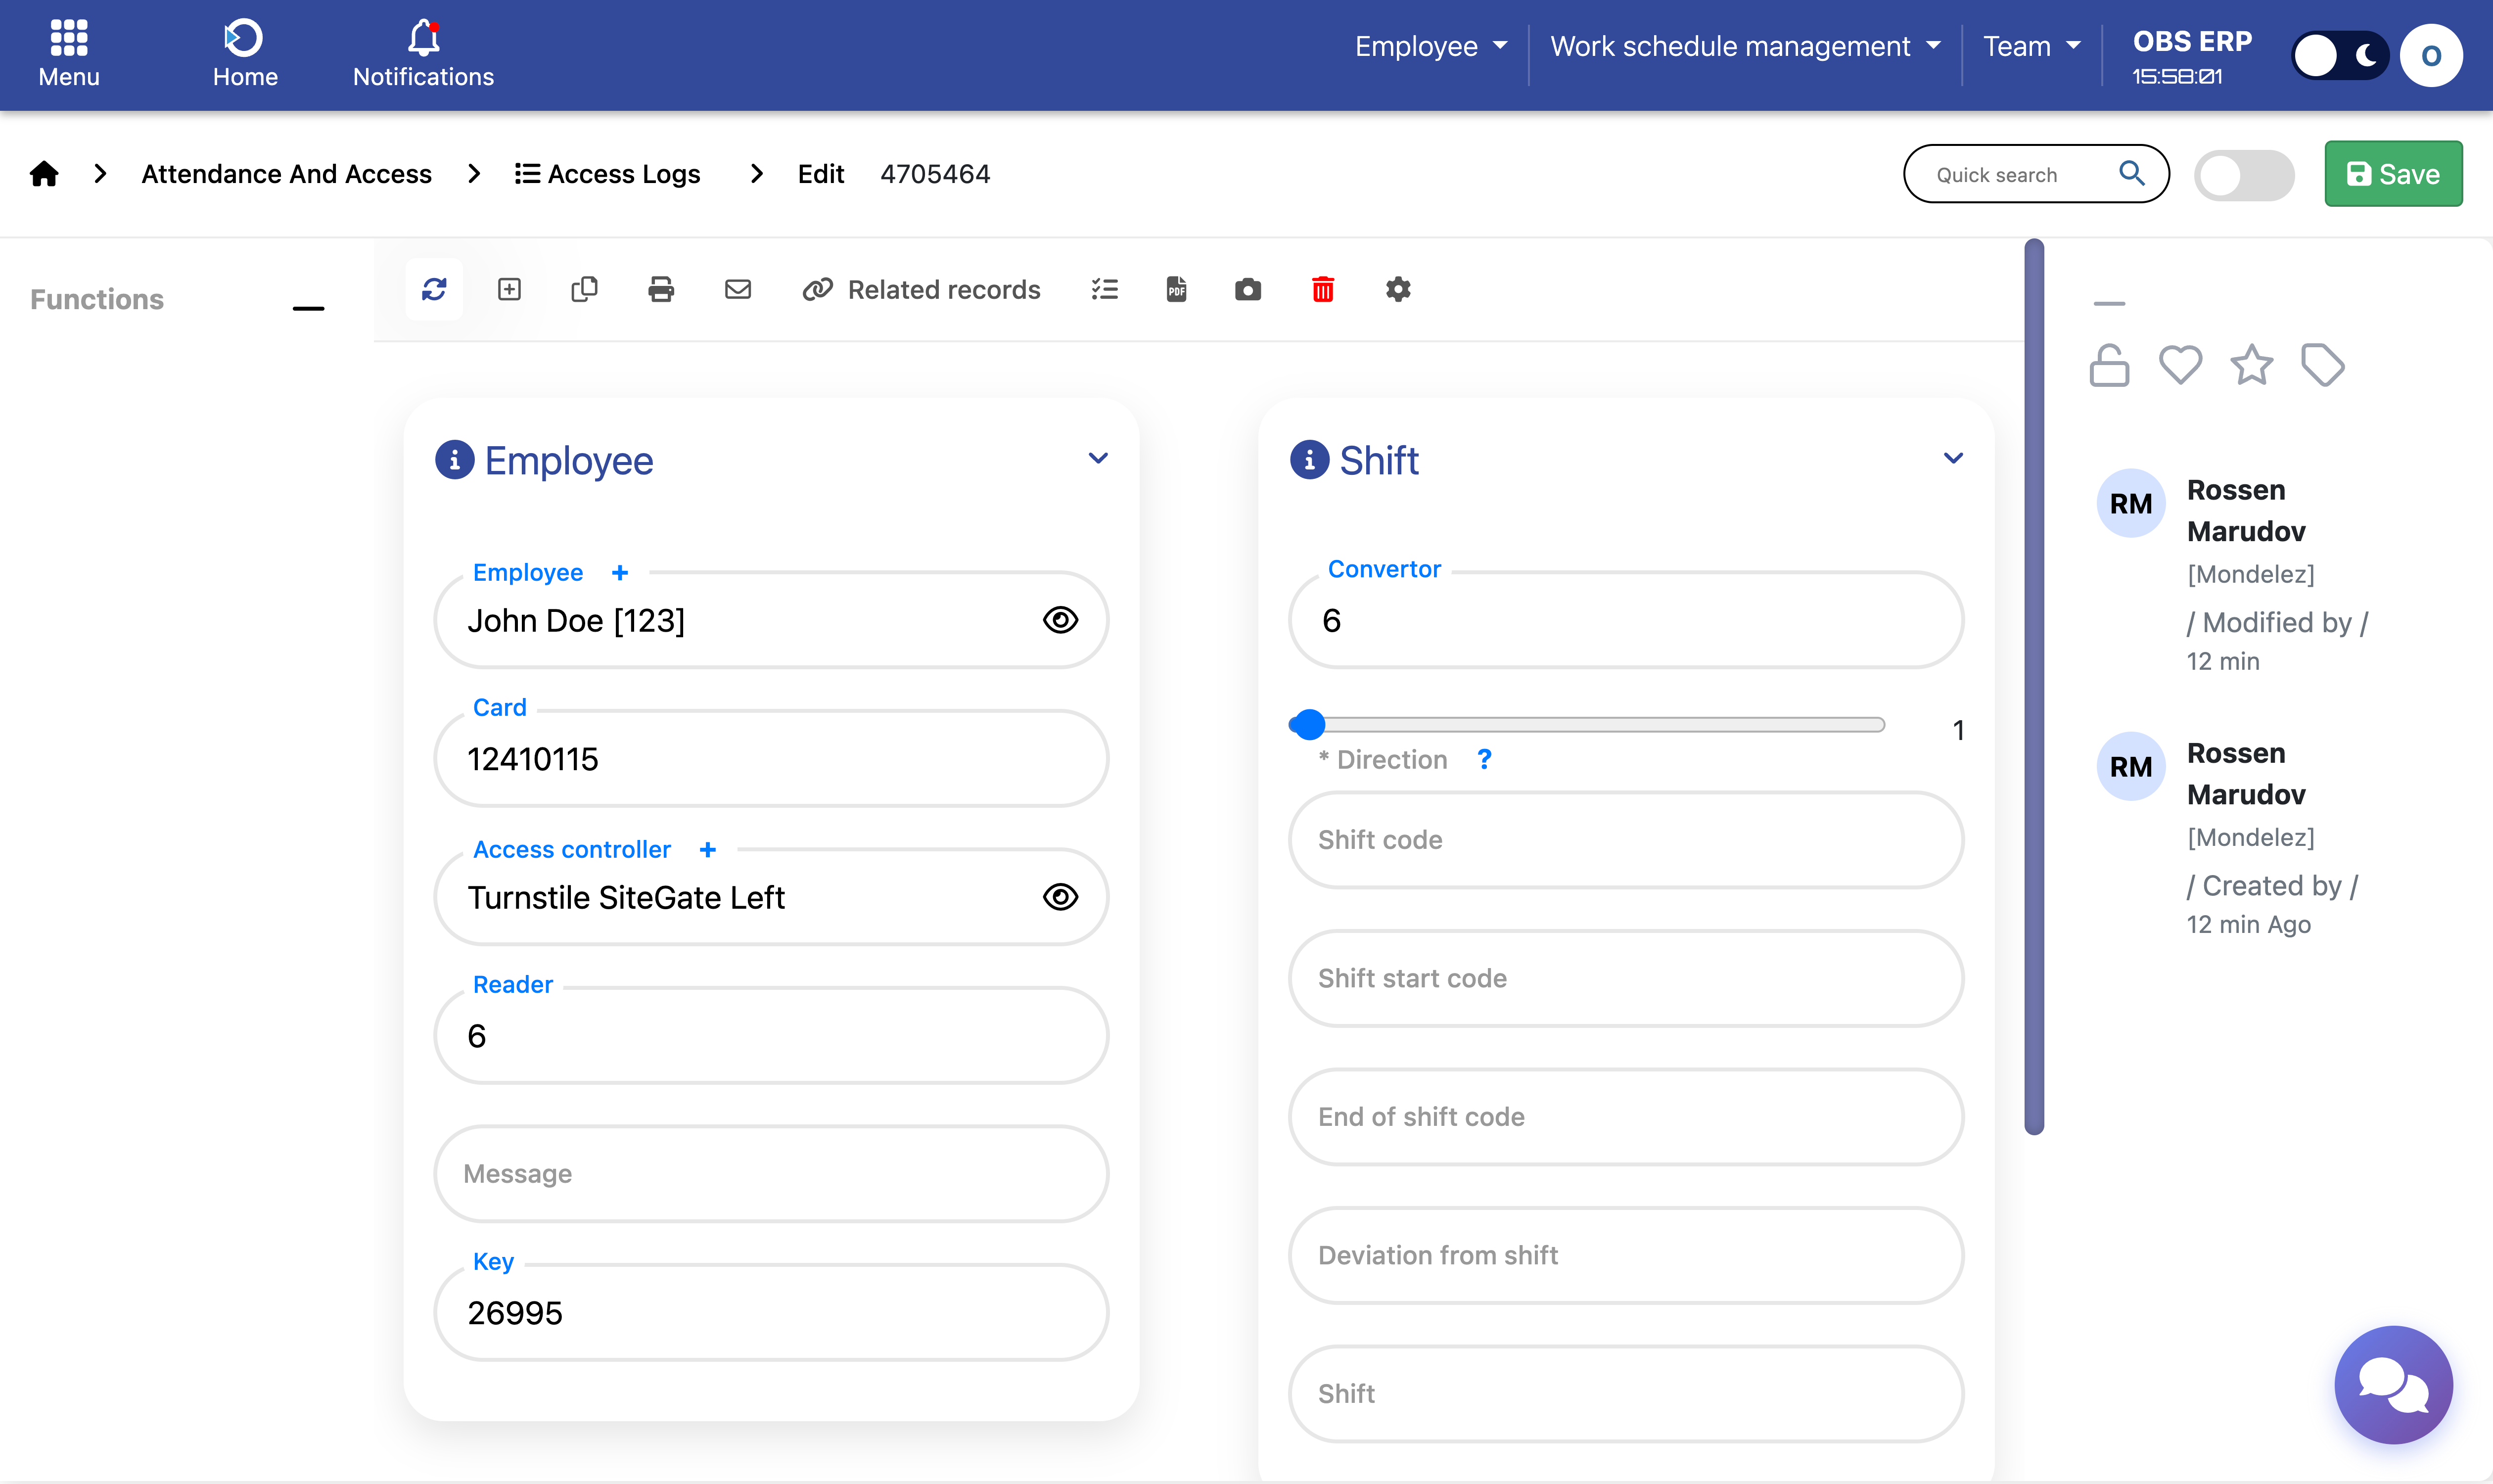
Access logs list showing recorded entry and exit events
Data Processing Automation
All processing is fully automated.
A background job runs periodically (typically every hour) and processes newly received access events. The system remembers the last processed event and recalculates attendance only for affected employees and dates.
During each processing cycle, the system:
- Detects new access events
- Identifies impacted employees and days
- Recalculates work shifts
- Updates daily attendance summaries
- Re-evaluates deviations and flags
- Records execution details in a processing log
This incremental approach guarantees:
- High performance - Efficient processing even with large data volumes.
- Near real-time accuracy - Data reflects the latest completed cycle.
- No manual intervention - Recalculation happens automatically.
Note: Attendance data is always accurate up to the last completed processing cycle. Recent badge scans will appear in reports after the next automated run.
Access Controllers
Access controllers are configured with a functional role that determines how events are interpreted.
Site Gates
Controllers that represent entering or leaving the site or building. Site gates define presence on site.
Examples:
- Main entrance turnstiles
- External security doors
- Vehicle entry points
Work Zones
Controllers that represent internal areas where productive work occurs. Work zones define net working time.
Examples:
- Laboratories
- Production areas
- GMP zones
- Restricted rooms
Important: An employee may be present on site without accumulating net work time until entering an assigned work zone. This distinction allows precise work time calculation even in complex environments.
Controller configuration is managed through the Access Controllers settings. See Configuration and Rules for details.
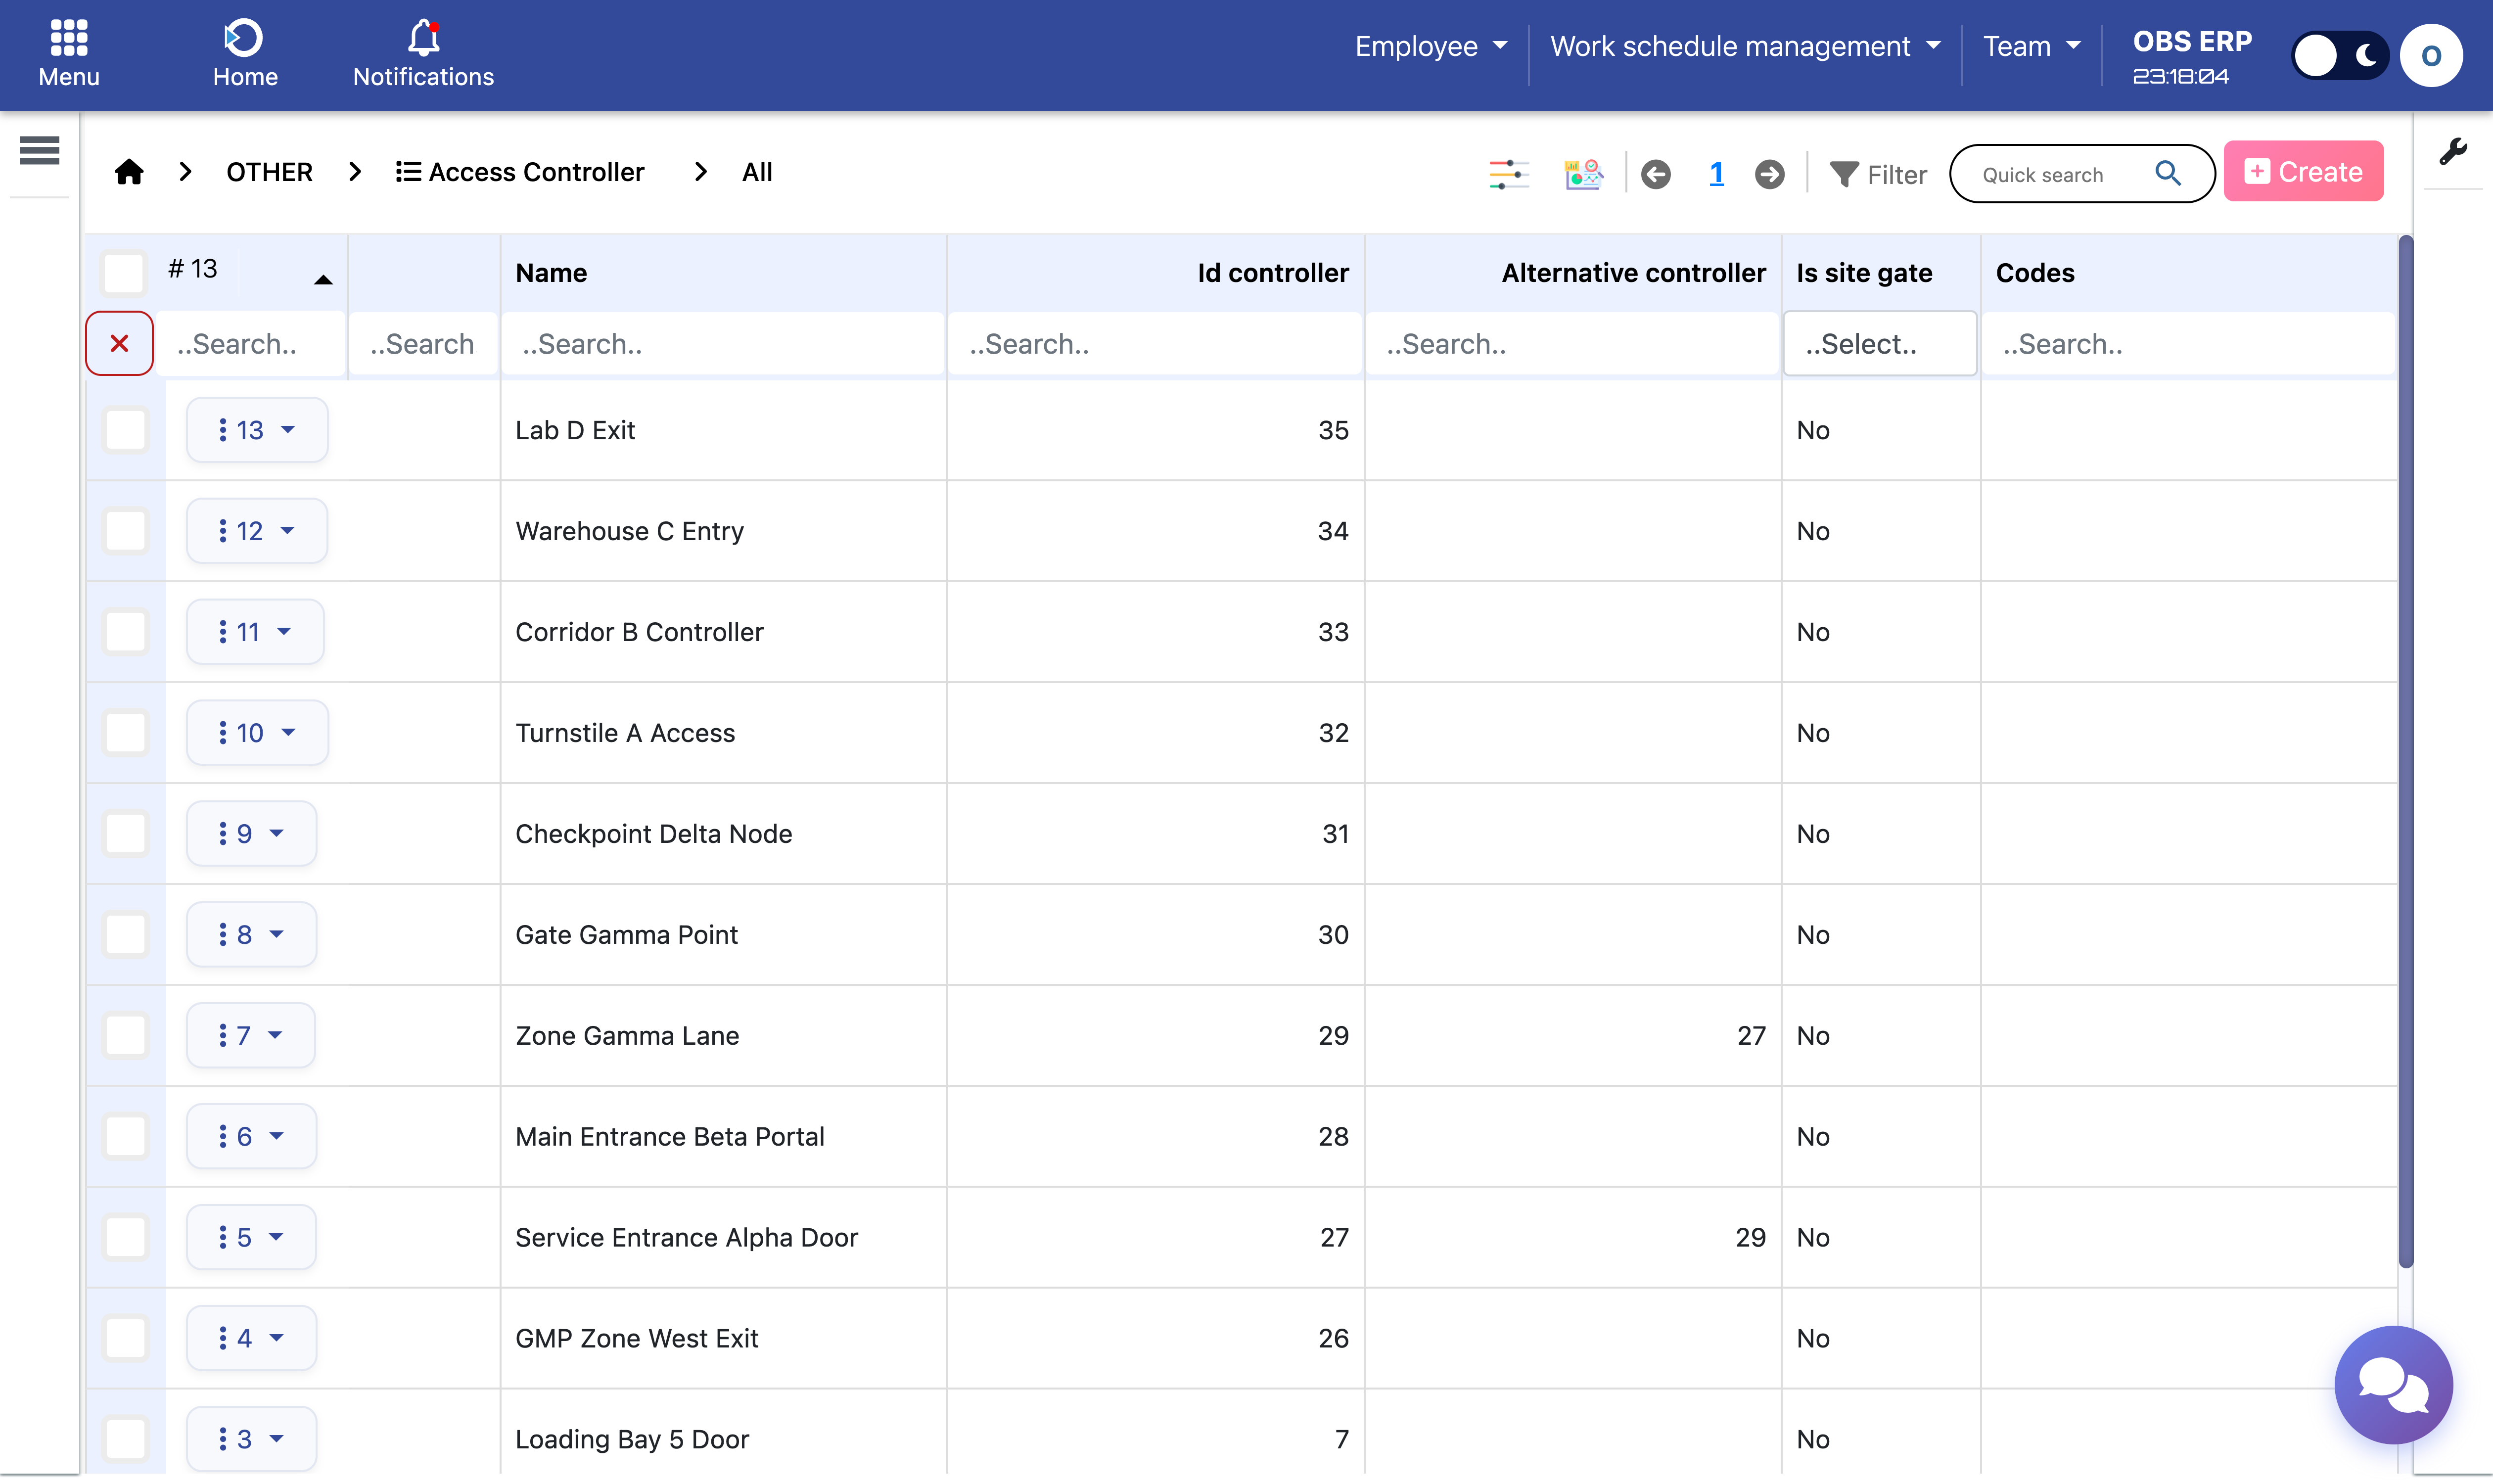
Access controller configuration showing site gate and work zone settings
Lone Workers Configuration
Lone workers are employees who work alone or in isolated conditions and require safety visibility.
Employees are manually designated as lone workers by an administrator. Once configured, the system provides:
- Real-time IN / OUT status - Current site presence based on last site gate event.
- Last known location - The most recent controller where the employee scanned.
- Movement history - Recent entries and exits with timestamps grouped by day.
- Contact information - Phone and email for quick response.
A dedicated monitoring screen provides real-time visibility for security personnel and supervisors.
Note: The system does not automatically detect incidents. It provides clear, up-to-date information so responsible staff can react quickly when needed.
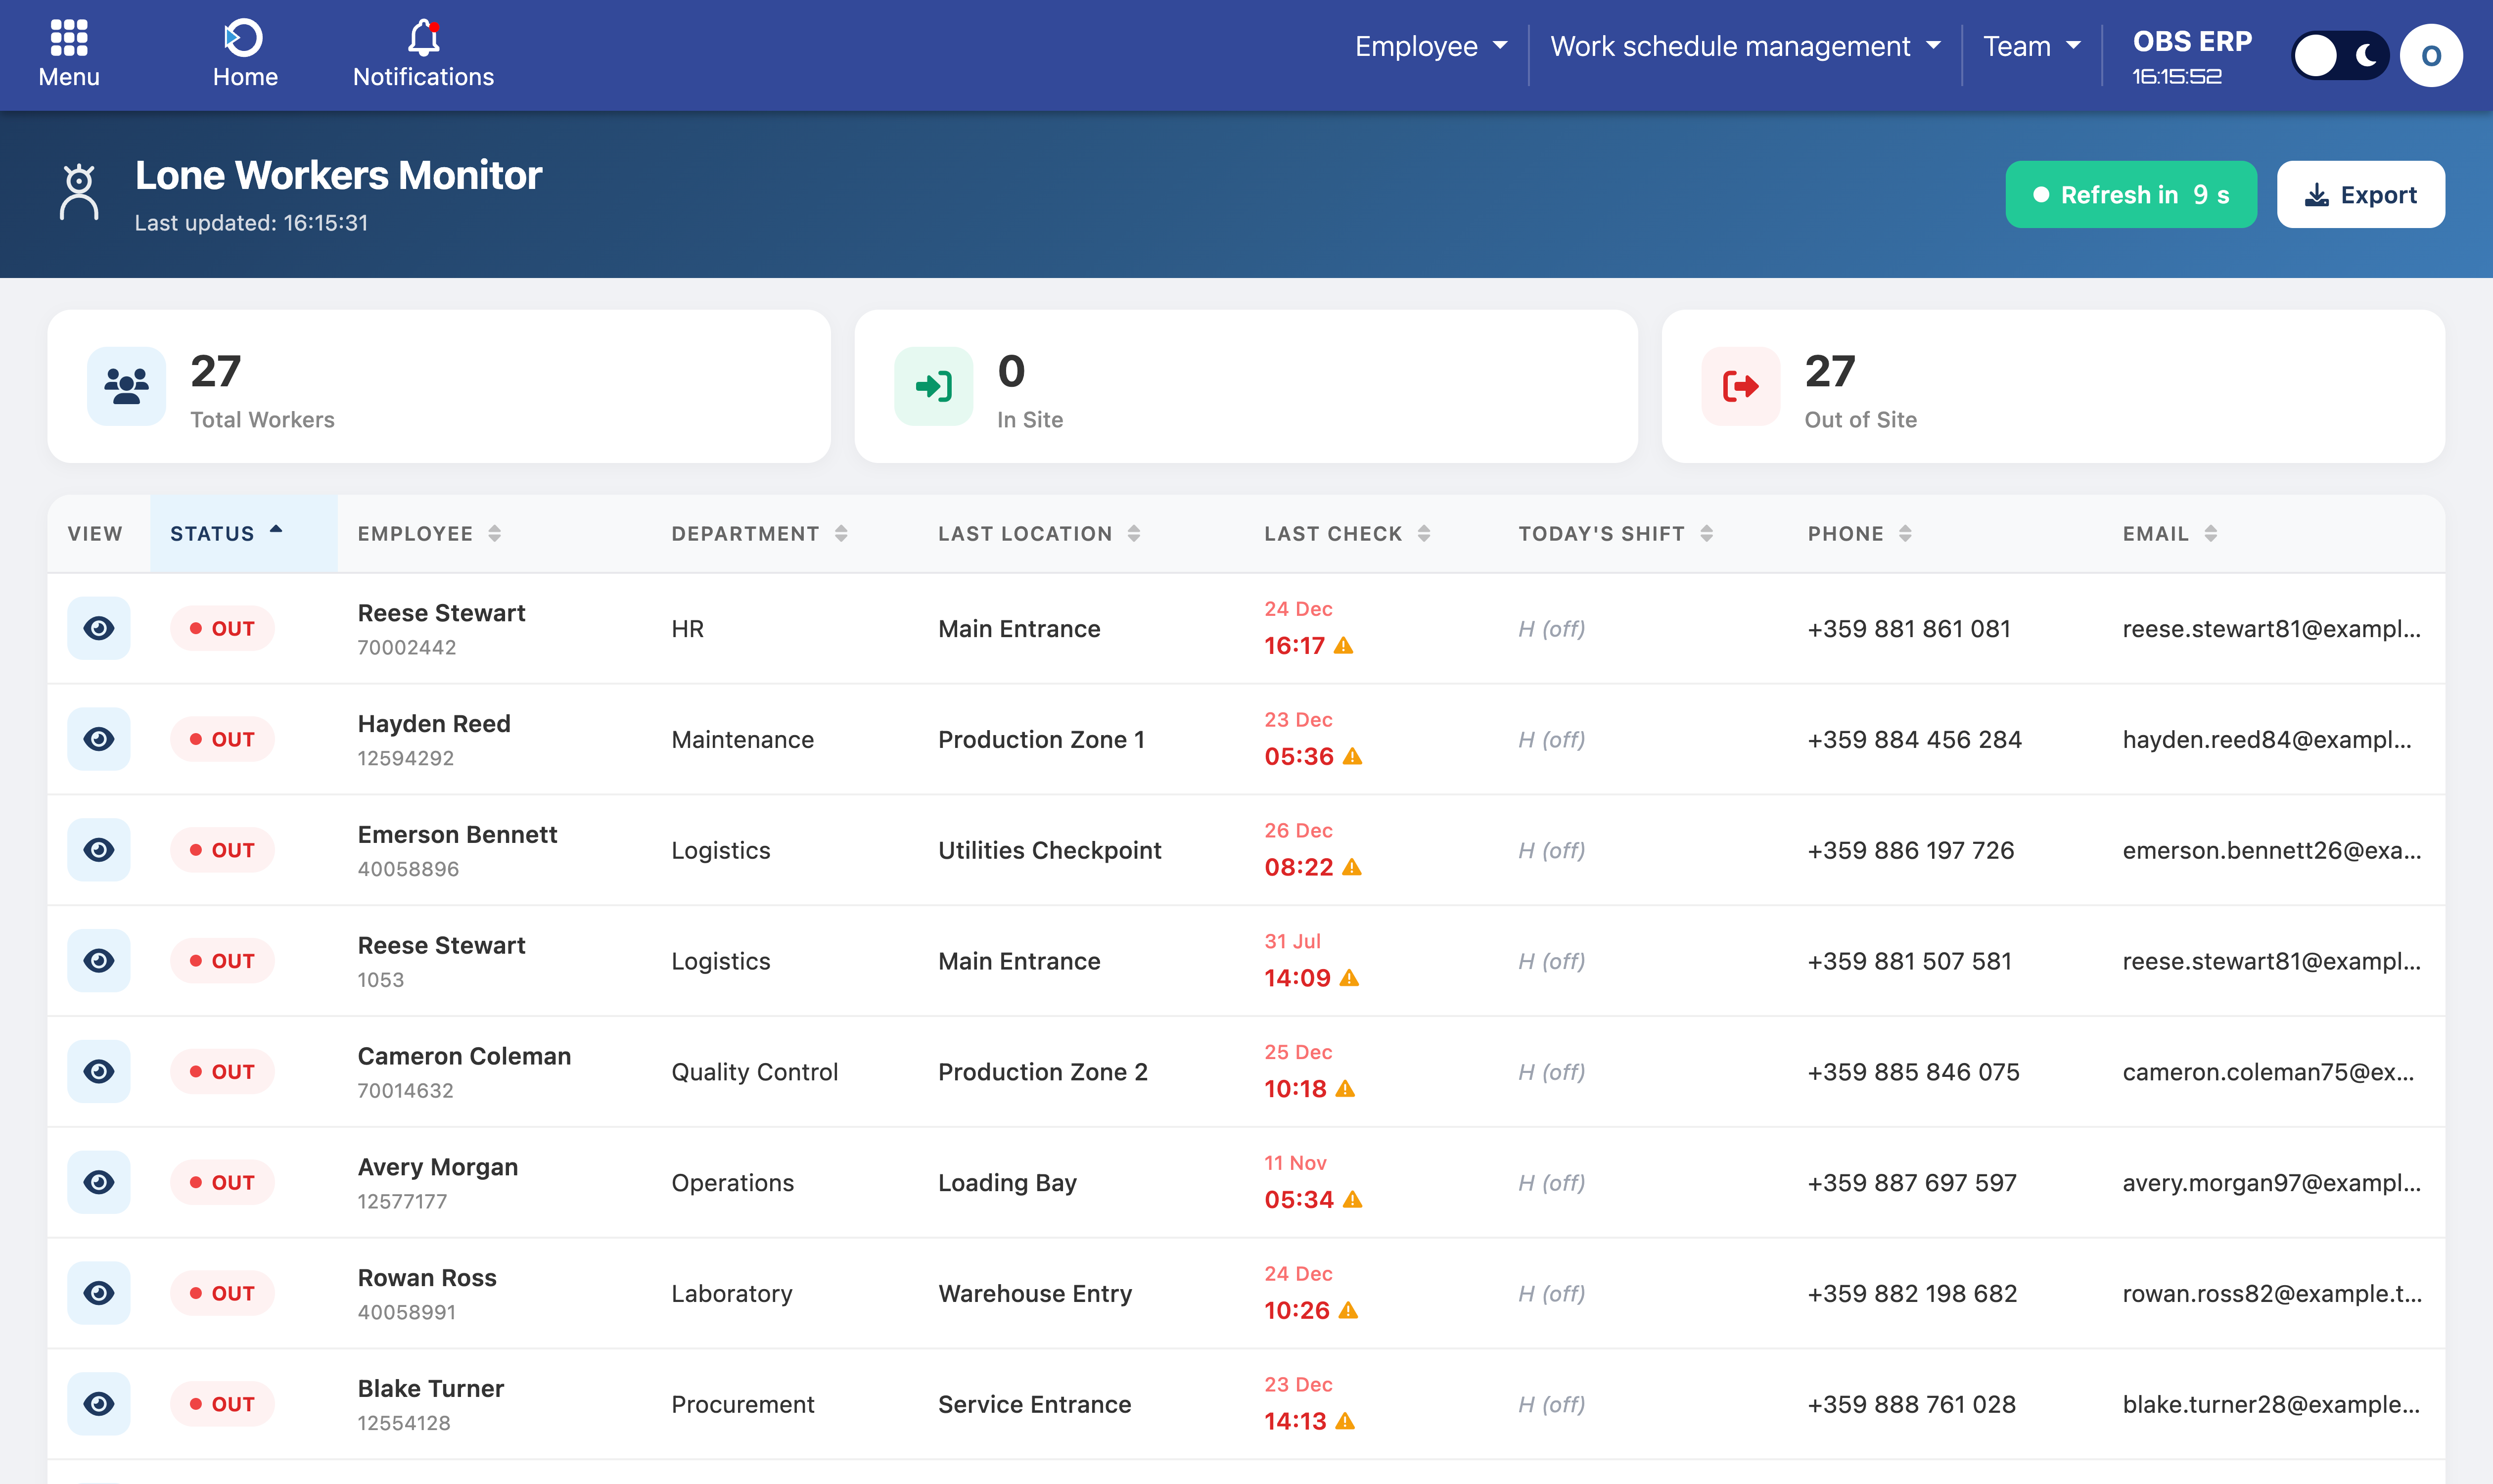
Lone Workers Monitor dashboard with real-time status and location tracking
Work Time Calculations
The system calculates several layers of working time for complete attendance visibility.
Brute Work Time
Total time between site gate entry and exit. This represents how long the employee was present on site.
Net Work Time
Time spent inside assigned work zones. This represents actual productive working time.
Planned Time
Expected working hours based on the employee's shift code for that day.
Example:
An employee enters the site at 08:00 and exits at 17:00 → Brute time: 9 hours
They enter the production zone at 08:30 and exit at 16:30 → Net work time: 8 hours
Their shift defines 8 planned hours → Planned time: 8 hours
Deviations and Flags
The system automatically detects conditions that may require attention:
- Late arrival - Employee entered after scheduled start time.
- Early departure - Employee left before scheduled end time.
- Missing entry or exit - Incomplete badge scan data.
- Long shifts - Work time exceeding defined thresholds.
- Work without schedule - Badge activity on unplanned days.
- Data inconsistencies - Net time exceeding brute time or other anomalies.

Daily attendance report showing calculated times and deviation flags
Calculation Rules
All calculations respect:
- Company-level configuration rules
- Department-specific work zone mappings
- Shift definitions and leave types
Results are available per shift, per day, per employee, and aggregated in reports.
Need Help? If you have questions about how attendance is calculated or notice unexpected results, contact your system administrator or refer to the Configuration and Rules section.