Data Listing
Data Listing
Depending on the context, you might want to visualize your data in different ways. OBS ERP provides the following data listing templates:
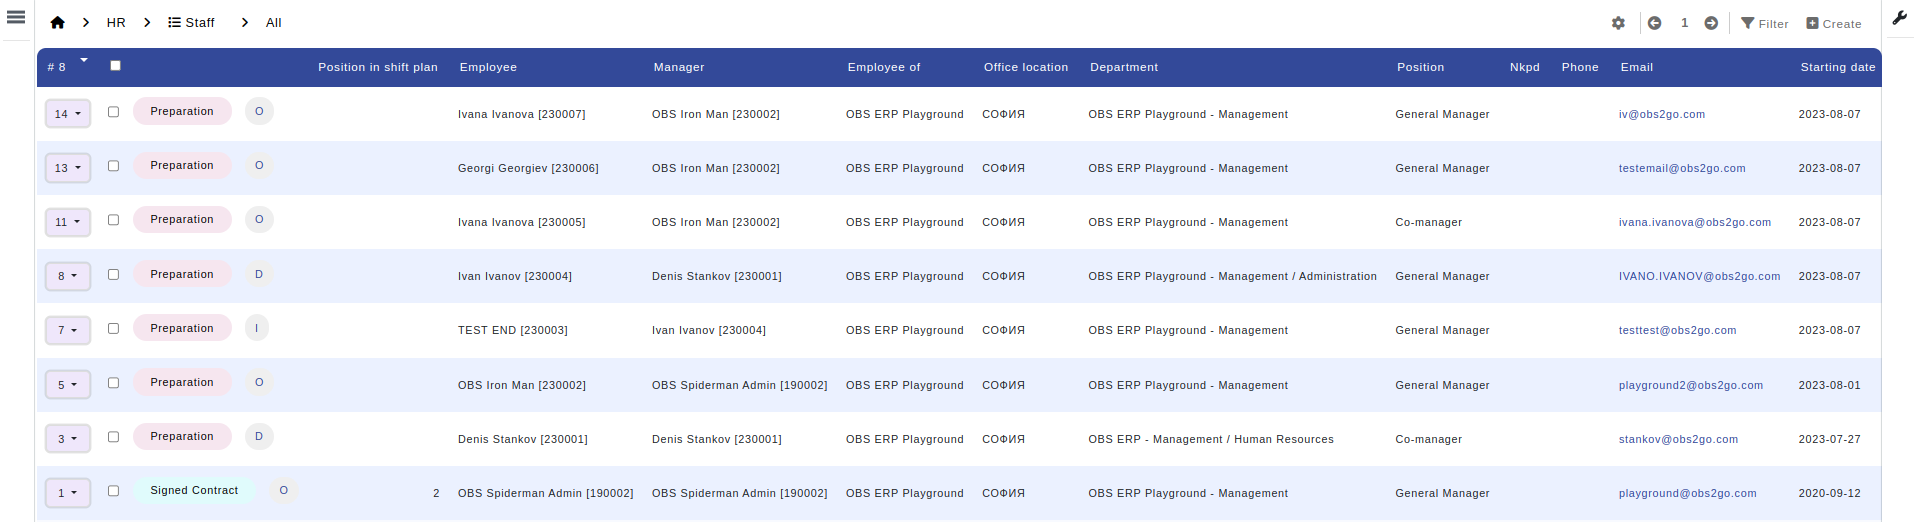
Table listing
The most common data listing method. It is used by default in most of the OBS ERP modules.
VCard
Used mainly in module "Contacts". Represents the data in vcard style.
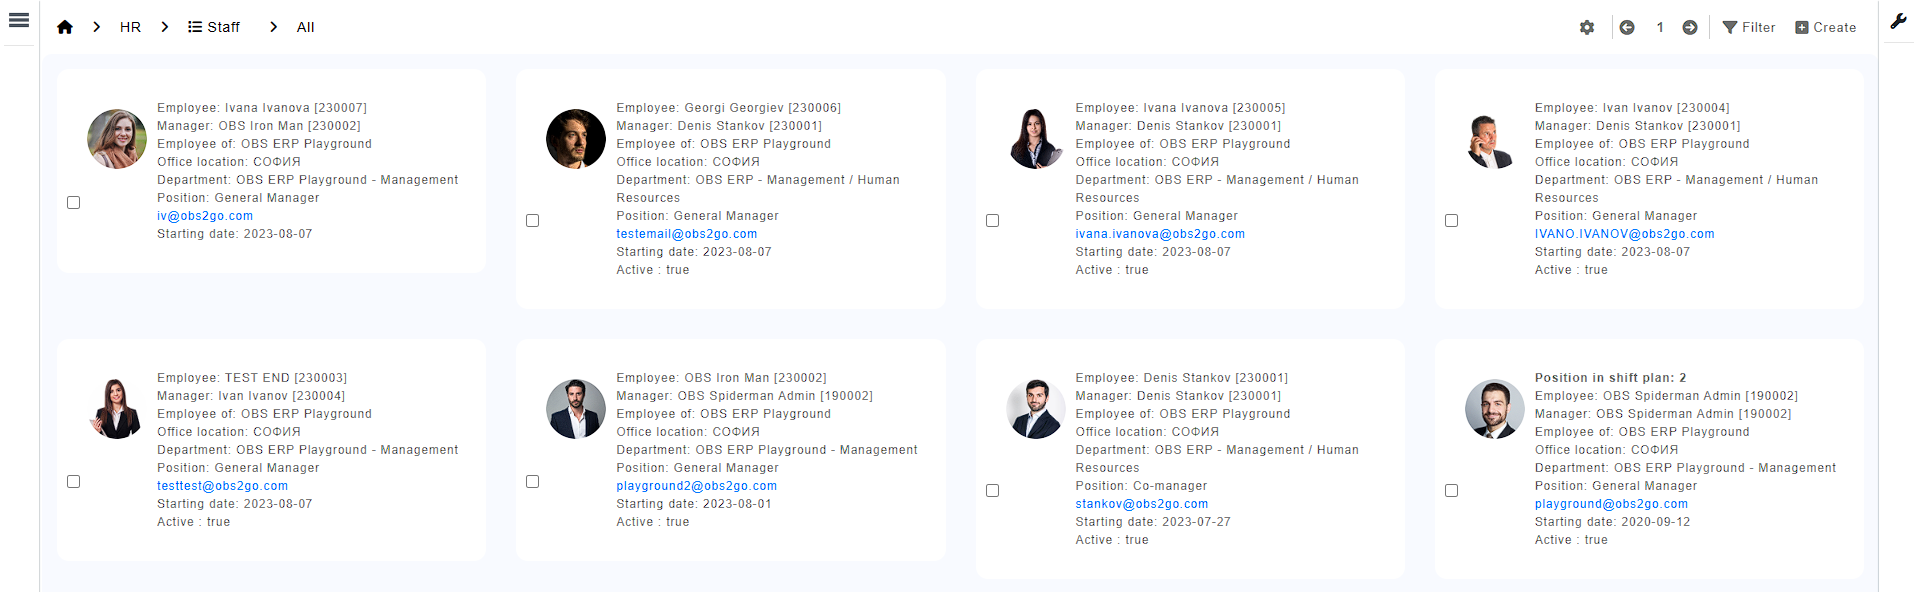
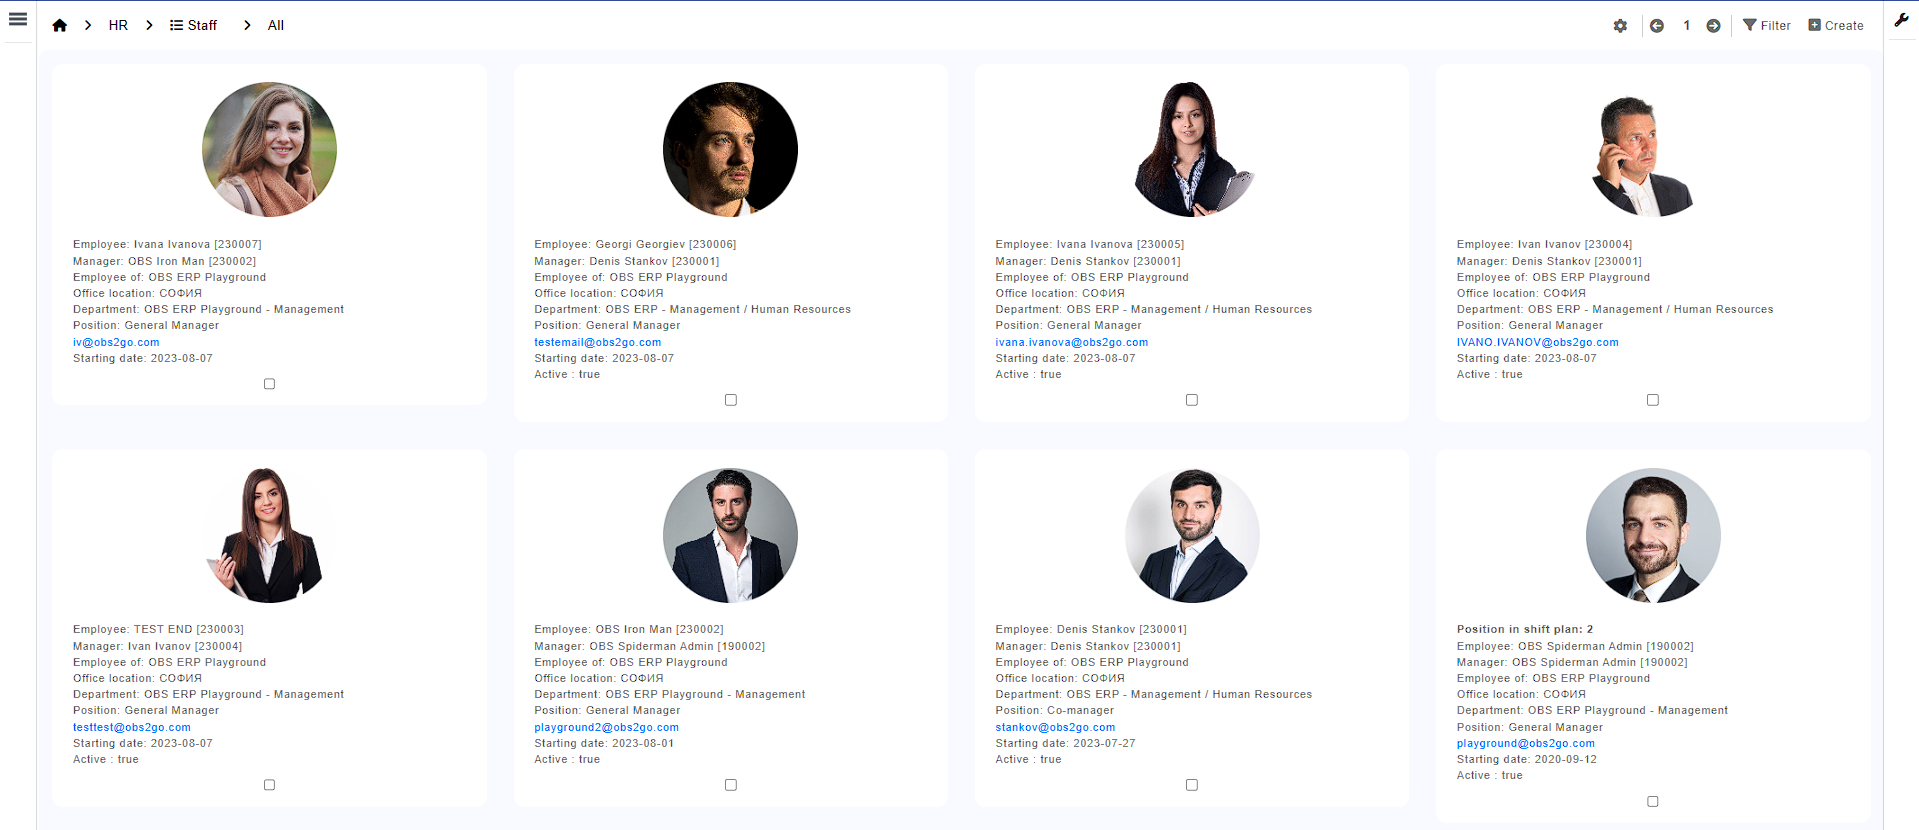
Profile
Similar to vcard, but represents the data vertically rather than horizontally.
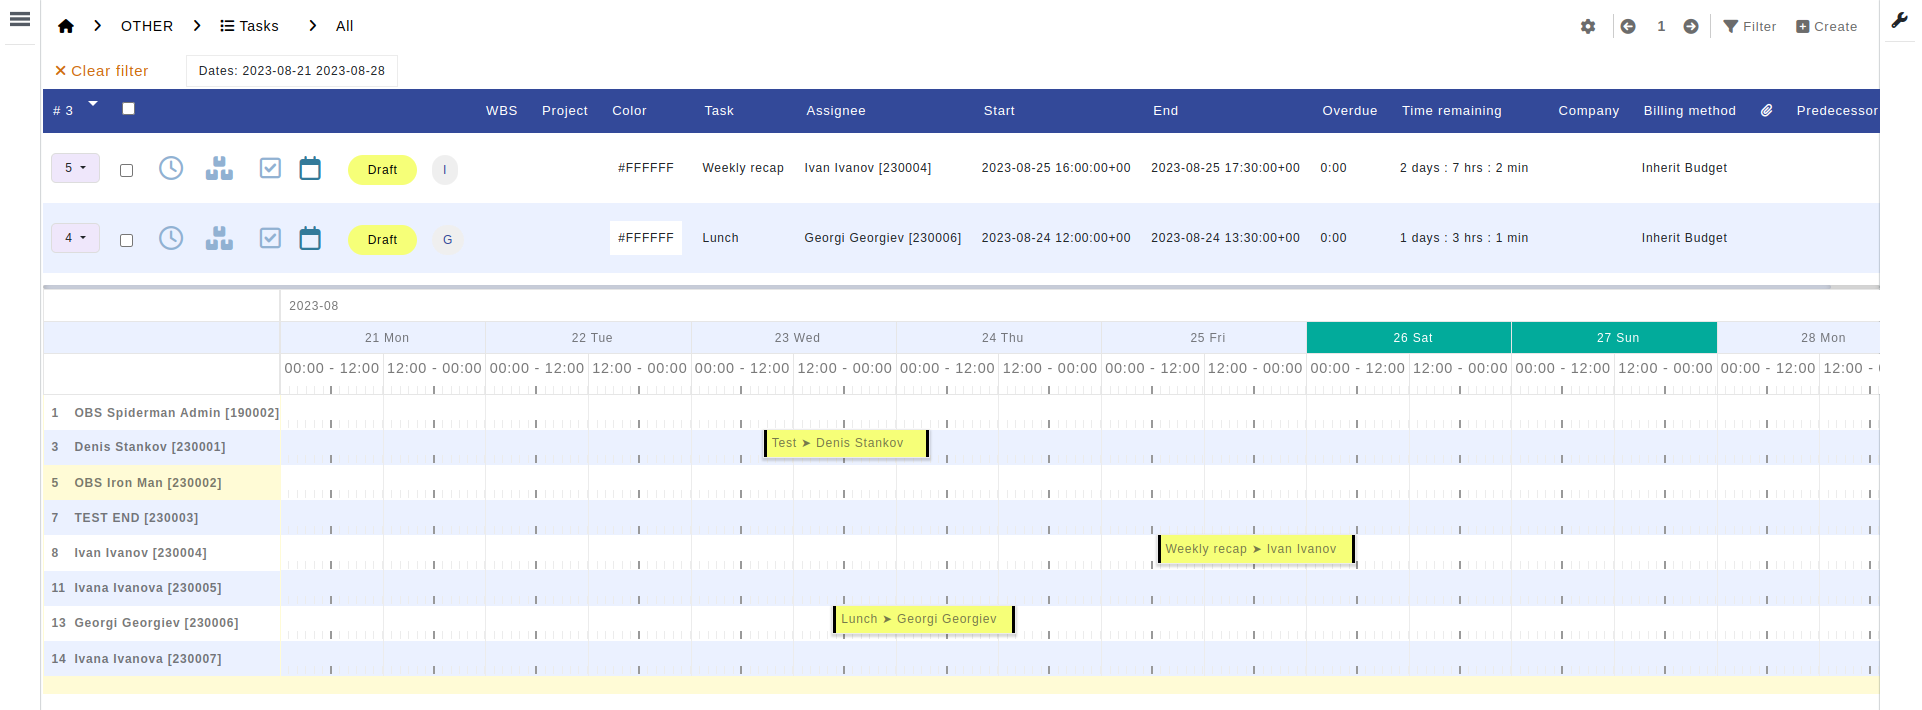
Gantt
Displays the data in Gantt chart format. Useful for modules "Projects" and "Tasks".
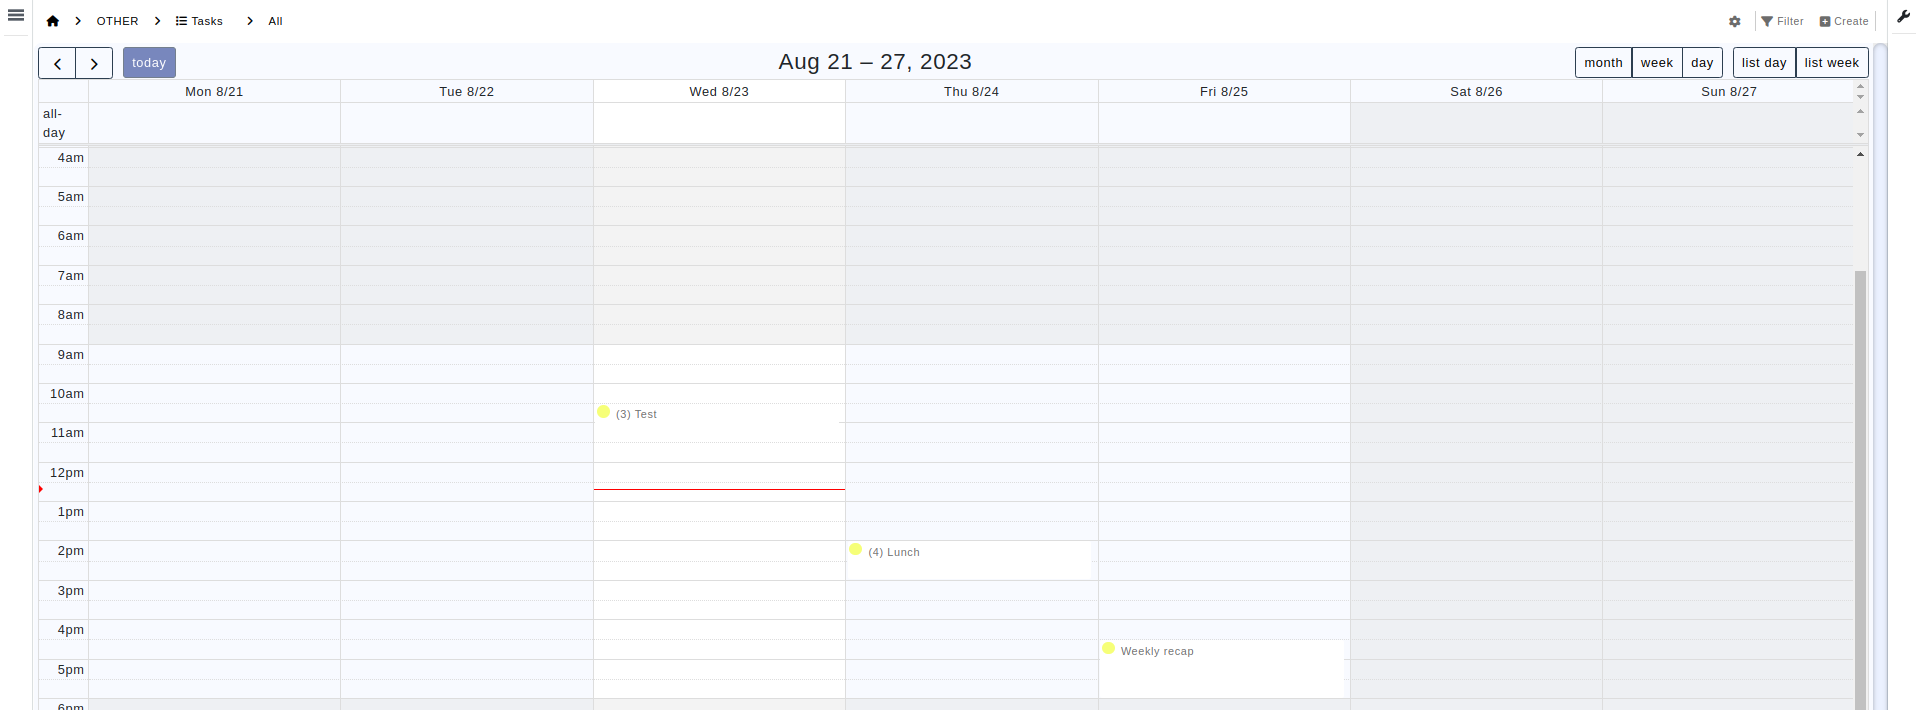
Calendar
Displays the data in google like calendar. Useful for all modules containing date fields, e.g. "Tasks".
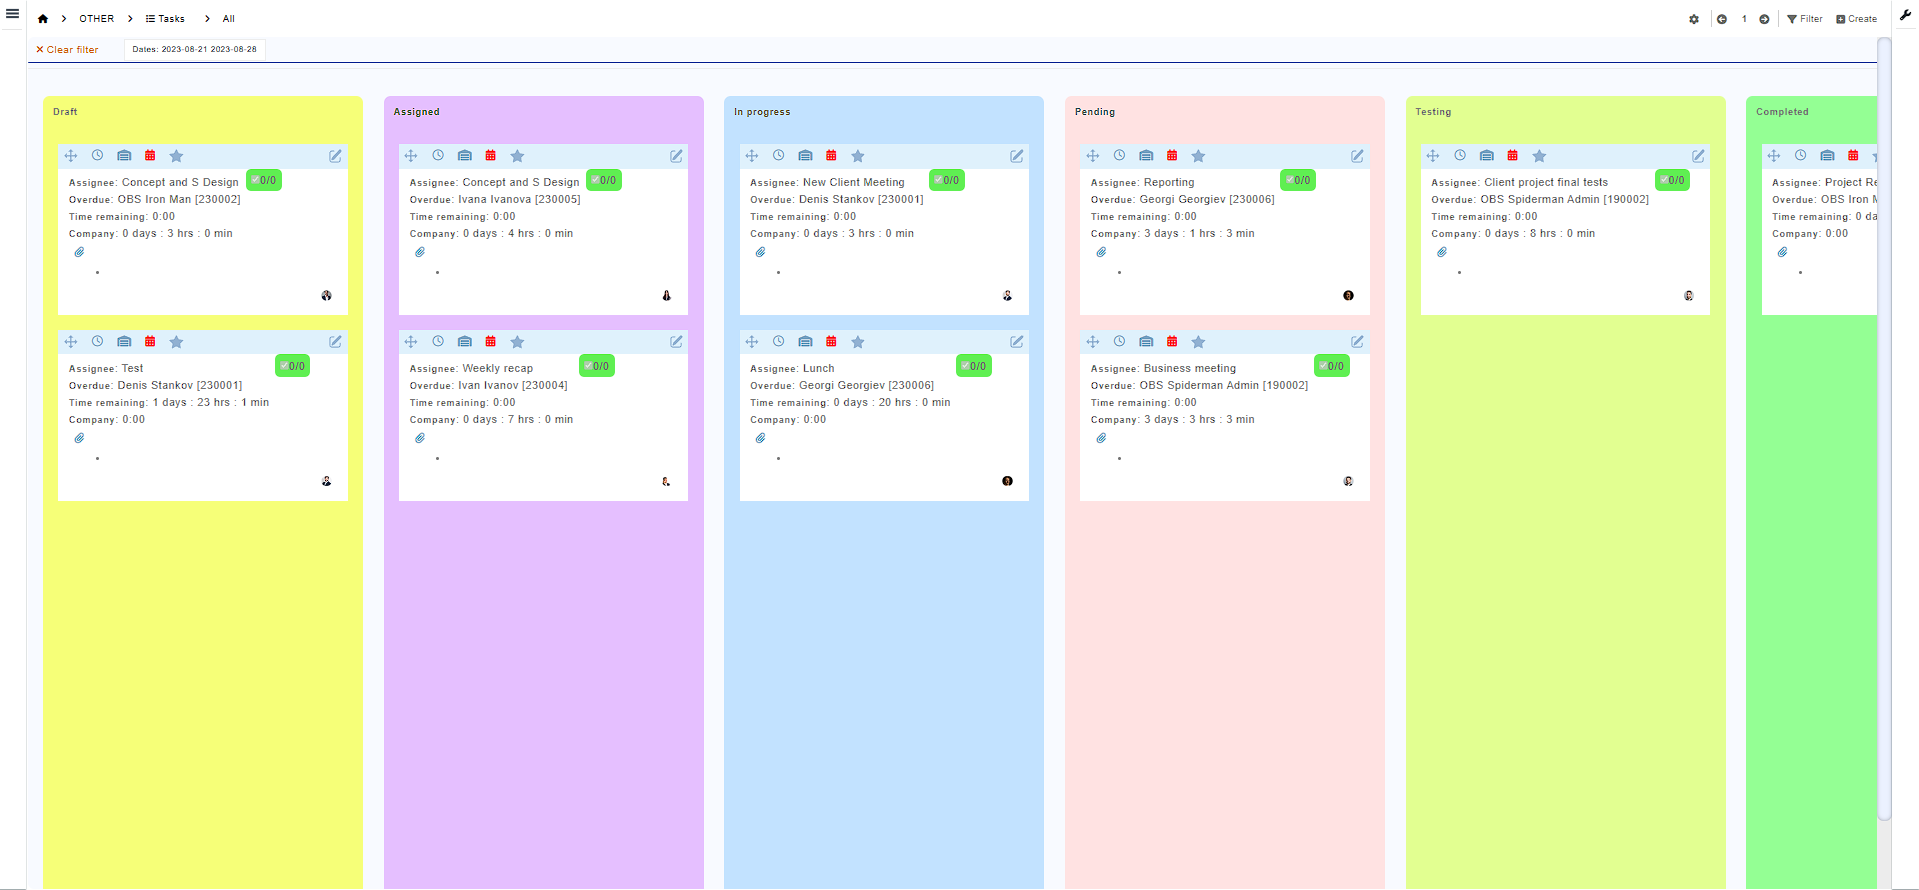
Kanban
Production cards perfect for visualization of ongoing work.
Modifying Default Record Display
By default, OBS ERP displays the most recent 30 records within a specific module. To modify this default value, locate and select the option enclosed within a red rectangle (Fig. 1). This action will trigger a pop-up window to appear. Within the pop-up, you can adjust the 'Rows per page' setting to specify the desired number of rows per page.
To navigate through the pages, utilize the left and right arrow buttons, as exemplified below:
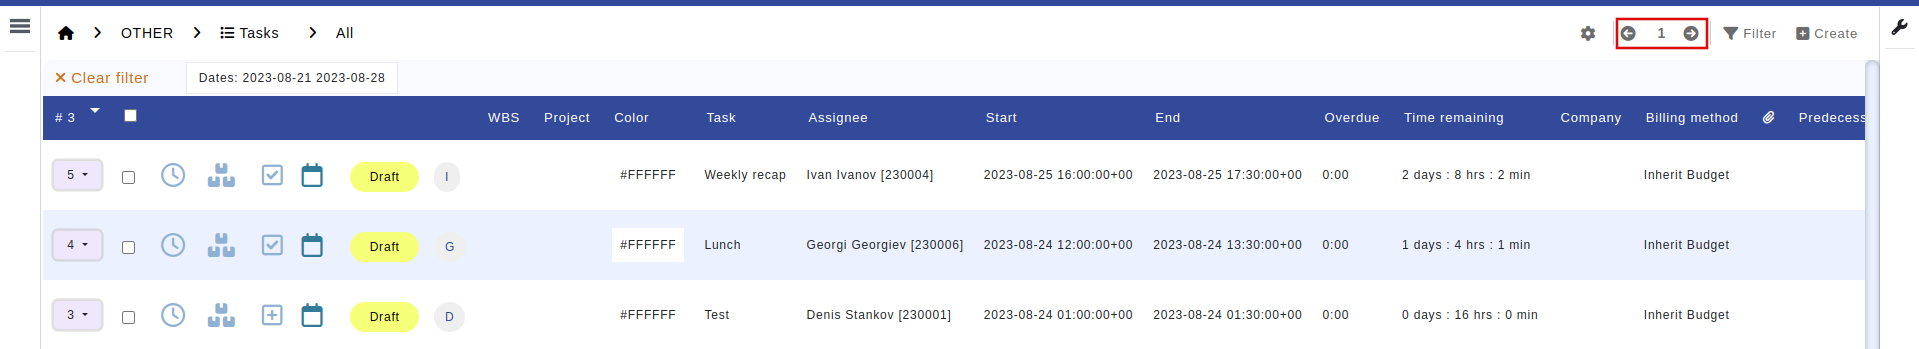
Fig. 1
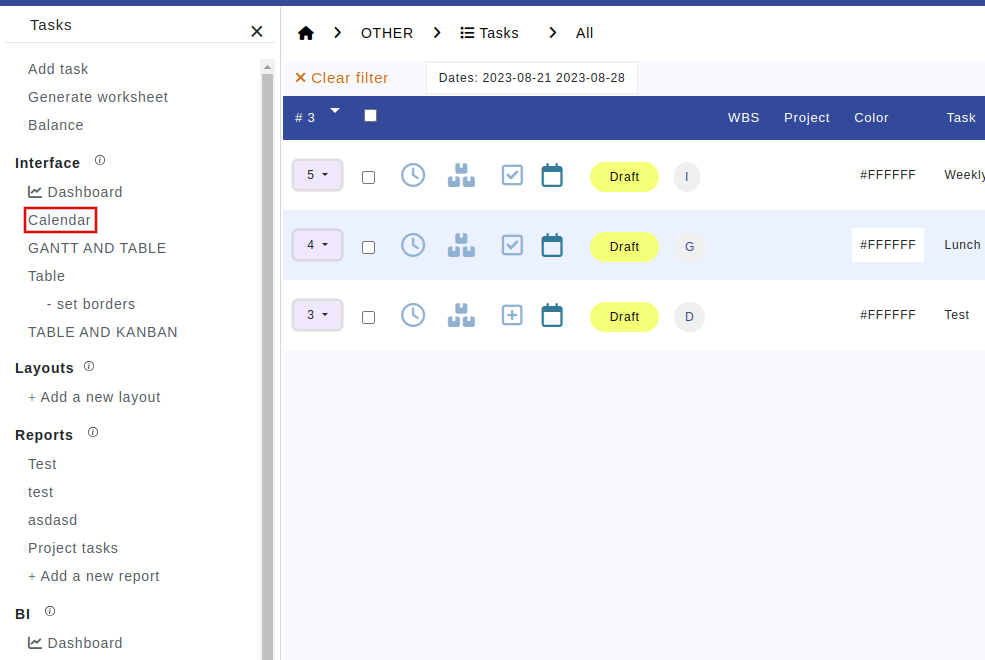
How to change between different data listing templates?
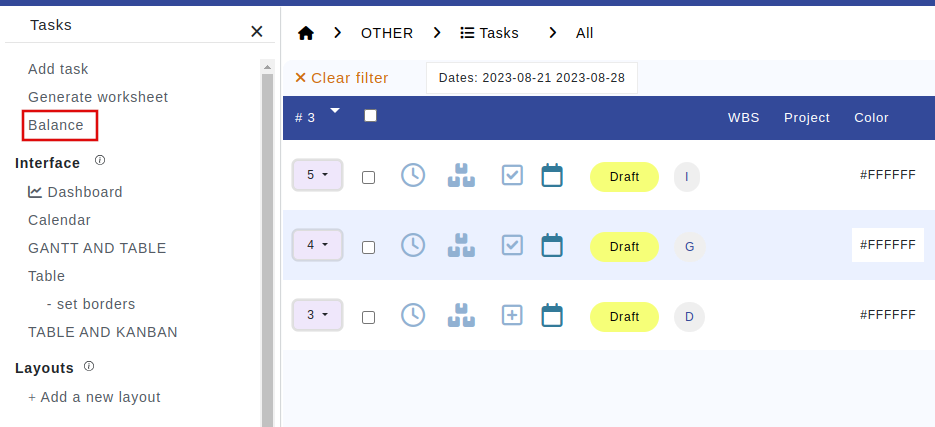
If you're using the table listing and want to switch to the calendar view, simply click the 'Menu' button on the left-hand side. A menu will appear, and then choose 'Calendar' from the 'Interface' options.
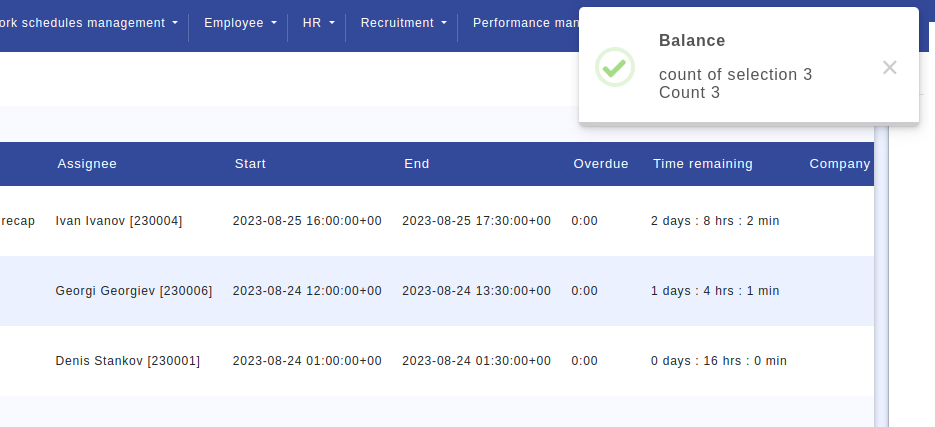
Displaying Total Number of Selected Rows
To reveal the total number of selected rows, click the 'Menu' button on the left-hand side. From the appearing menu, choose 'Balance,' and OBS ERP will compute and display the totals in a pop-up at the top-right corner of the screen.